We proposed a new method – running a high resolution water model for flooding risk estimation. The detailed flooding information can be achieved by simulating the flooding process, which combines the land, river, weather, and ocean conditions (include storm surge impact), and is more reliable. The general idea is to estimate the flooding risk for a region based on historical extreme events. We can apply the historical extreme events (weather, river and ocean conditions) or predicted events to drive the water model and estimate the flooding risk. This feature can also be applied to different project estimations, such as highway, railway, bridge, etc.
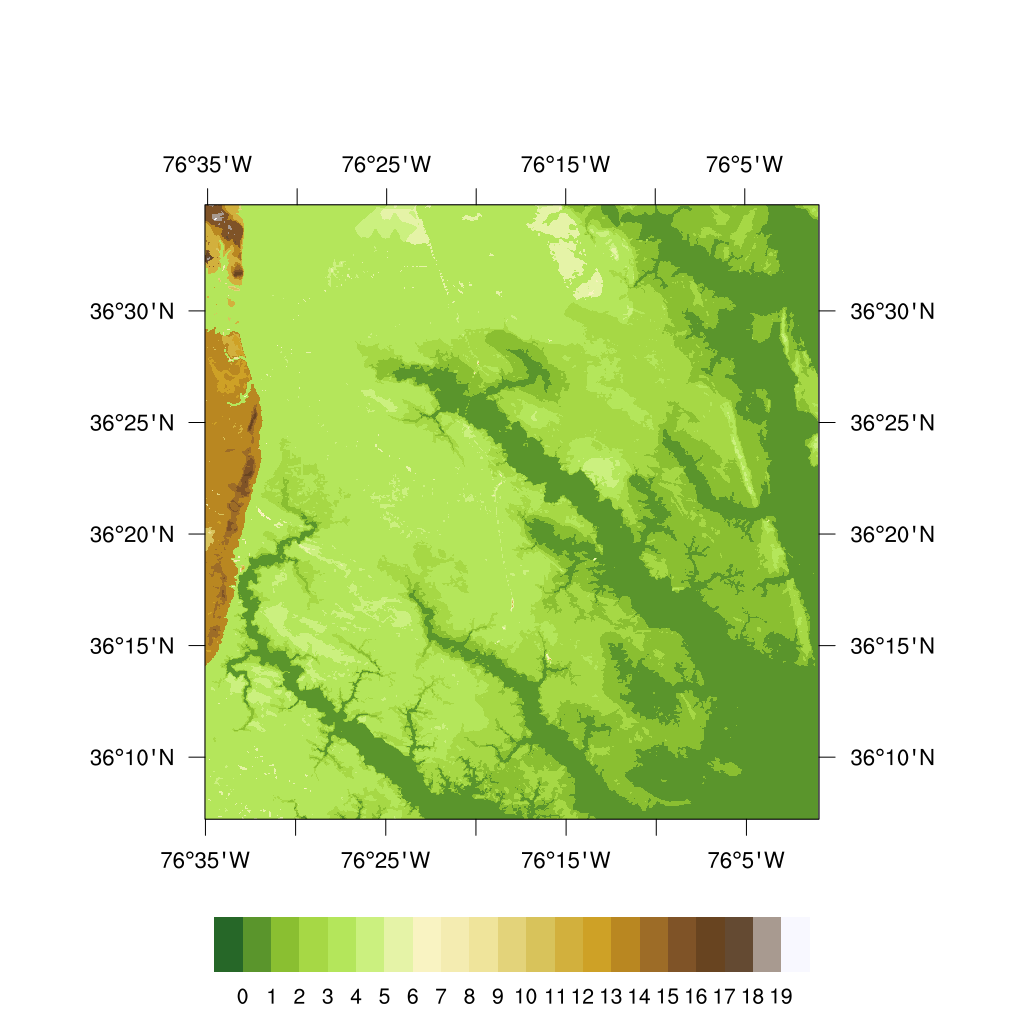
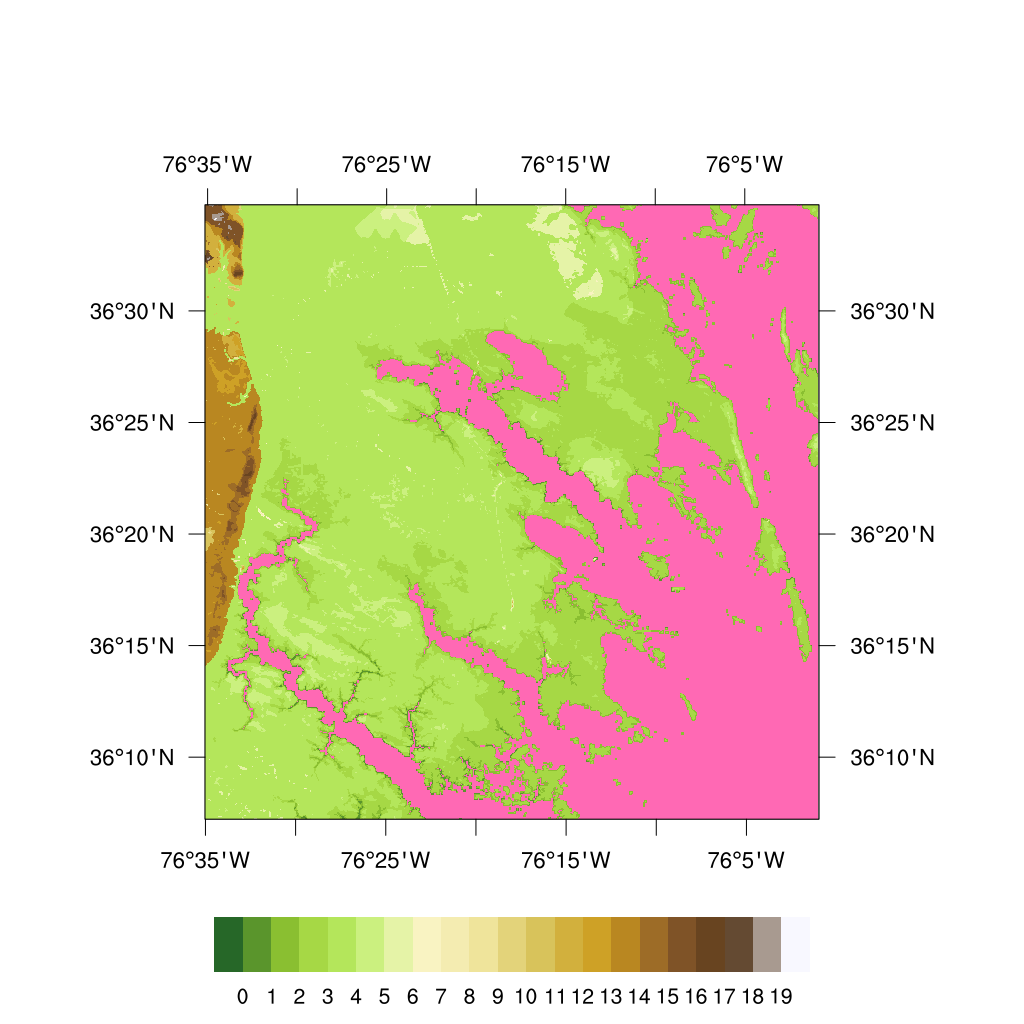
Figure 1 is a small domain along the coastal line. The land routing grid resolution is 100 meters. Assume that the sea level water increased 2 meters, the flooding area can be marked as in Figure 2.
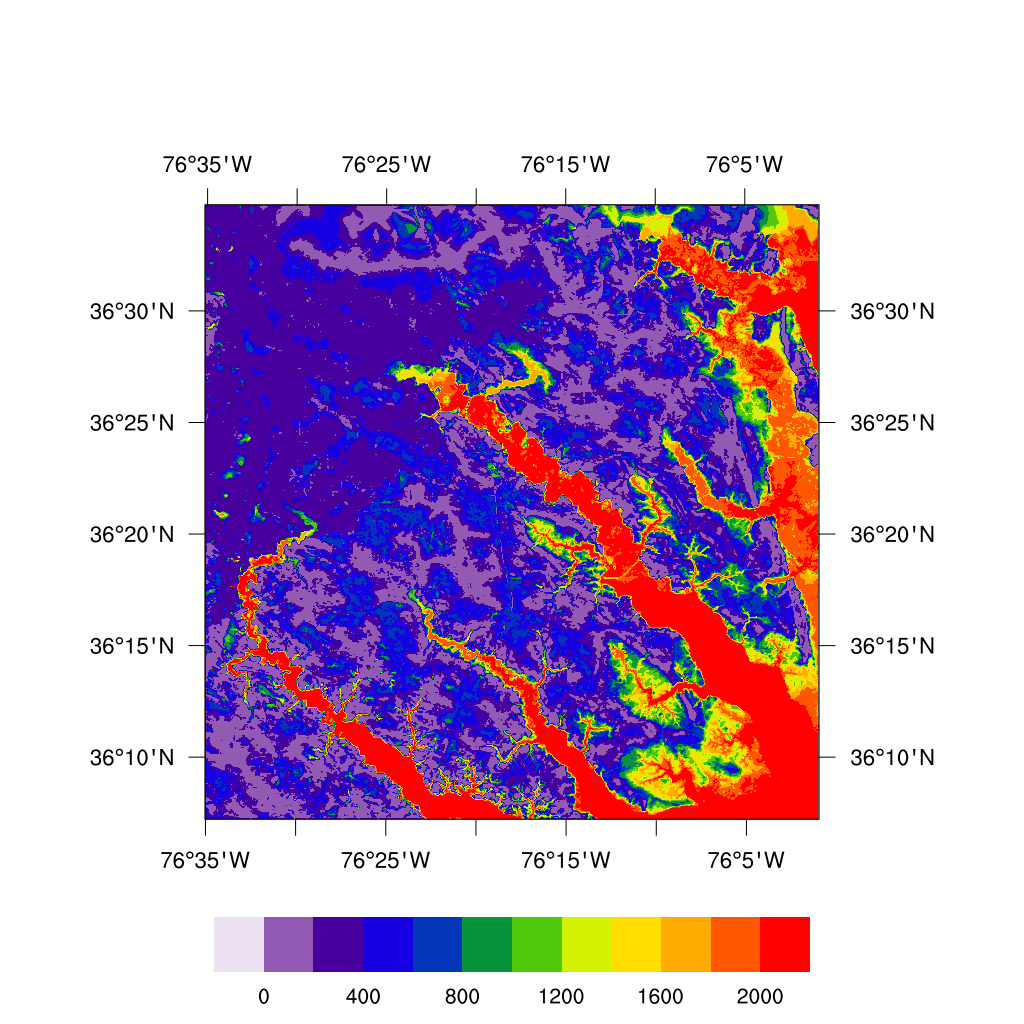
Given the time series of the sea level water increases from 0 to 2 meters, the animation of the inundation process is demonstrated in the followin animation figure. When combined with the heavy precipitation that 25 mm/hour precipitation lasted for 24 hours, the maximum ponded water situation during the simulation period can be described in Figure 3. This information is very important to local residents and can only be achieved through the physical model. In real time application, the sea level water height and precipitation will be input from the real time data. For flooding risk estimation, those can be the reference data, such as from the extreme events.

- Hurricane Florence testing case from professor Xue’s team (LSU) and USGS
2D ROMS share same grid with WRF-Hydro (100 m resolution)
WRF-Hydro running with land surface routing and channel routing activated
Zeta from ROMS is passed to WRF-Hydro surface routing on hourly basis along the boundary