Case 1 Model performance – self-learning function
The testing domain is located in California (USGS station 11447360). It is a residential area, where the soil infiltration and surface discharge will be different from the rural area. The regular WRF-Hydro model completely failed for this case. Our model has sel-learning function to fit the land type change. The model results and observation are matched very well from the 3 months simulation.

Model simulation from hydro-extension with horizontal grid resolution 100 meters.

Case 2 Reservoir /water management function

The upstream reservoir discharge data can be read by the model. This is the simulation of the downstream reservoir input and observation. The unit is m^3/s. Except for the water resource prediction for the regular water management, it can also be applied to predict the downstream flooding information related to the upstream reservoir discharge.
Case 3 City flooding
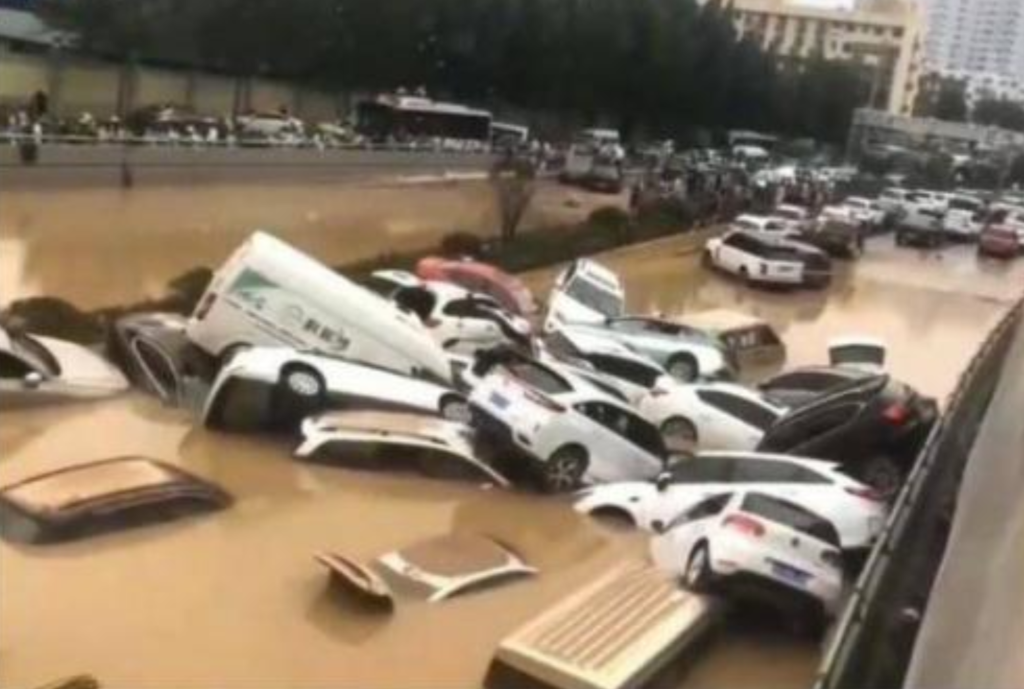
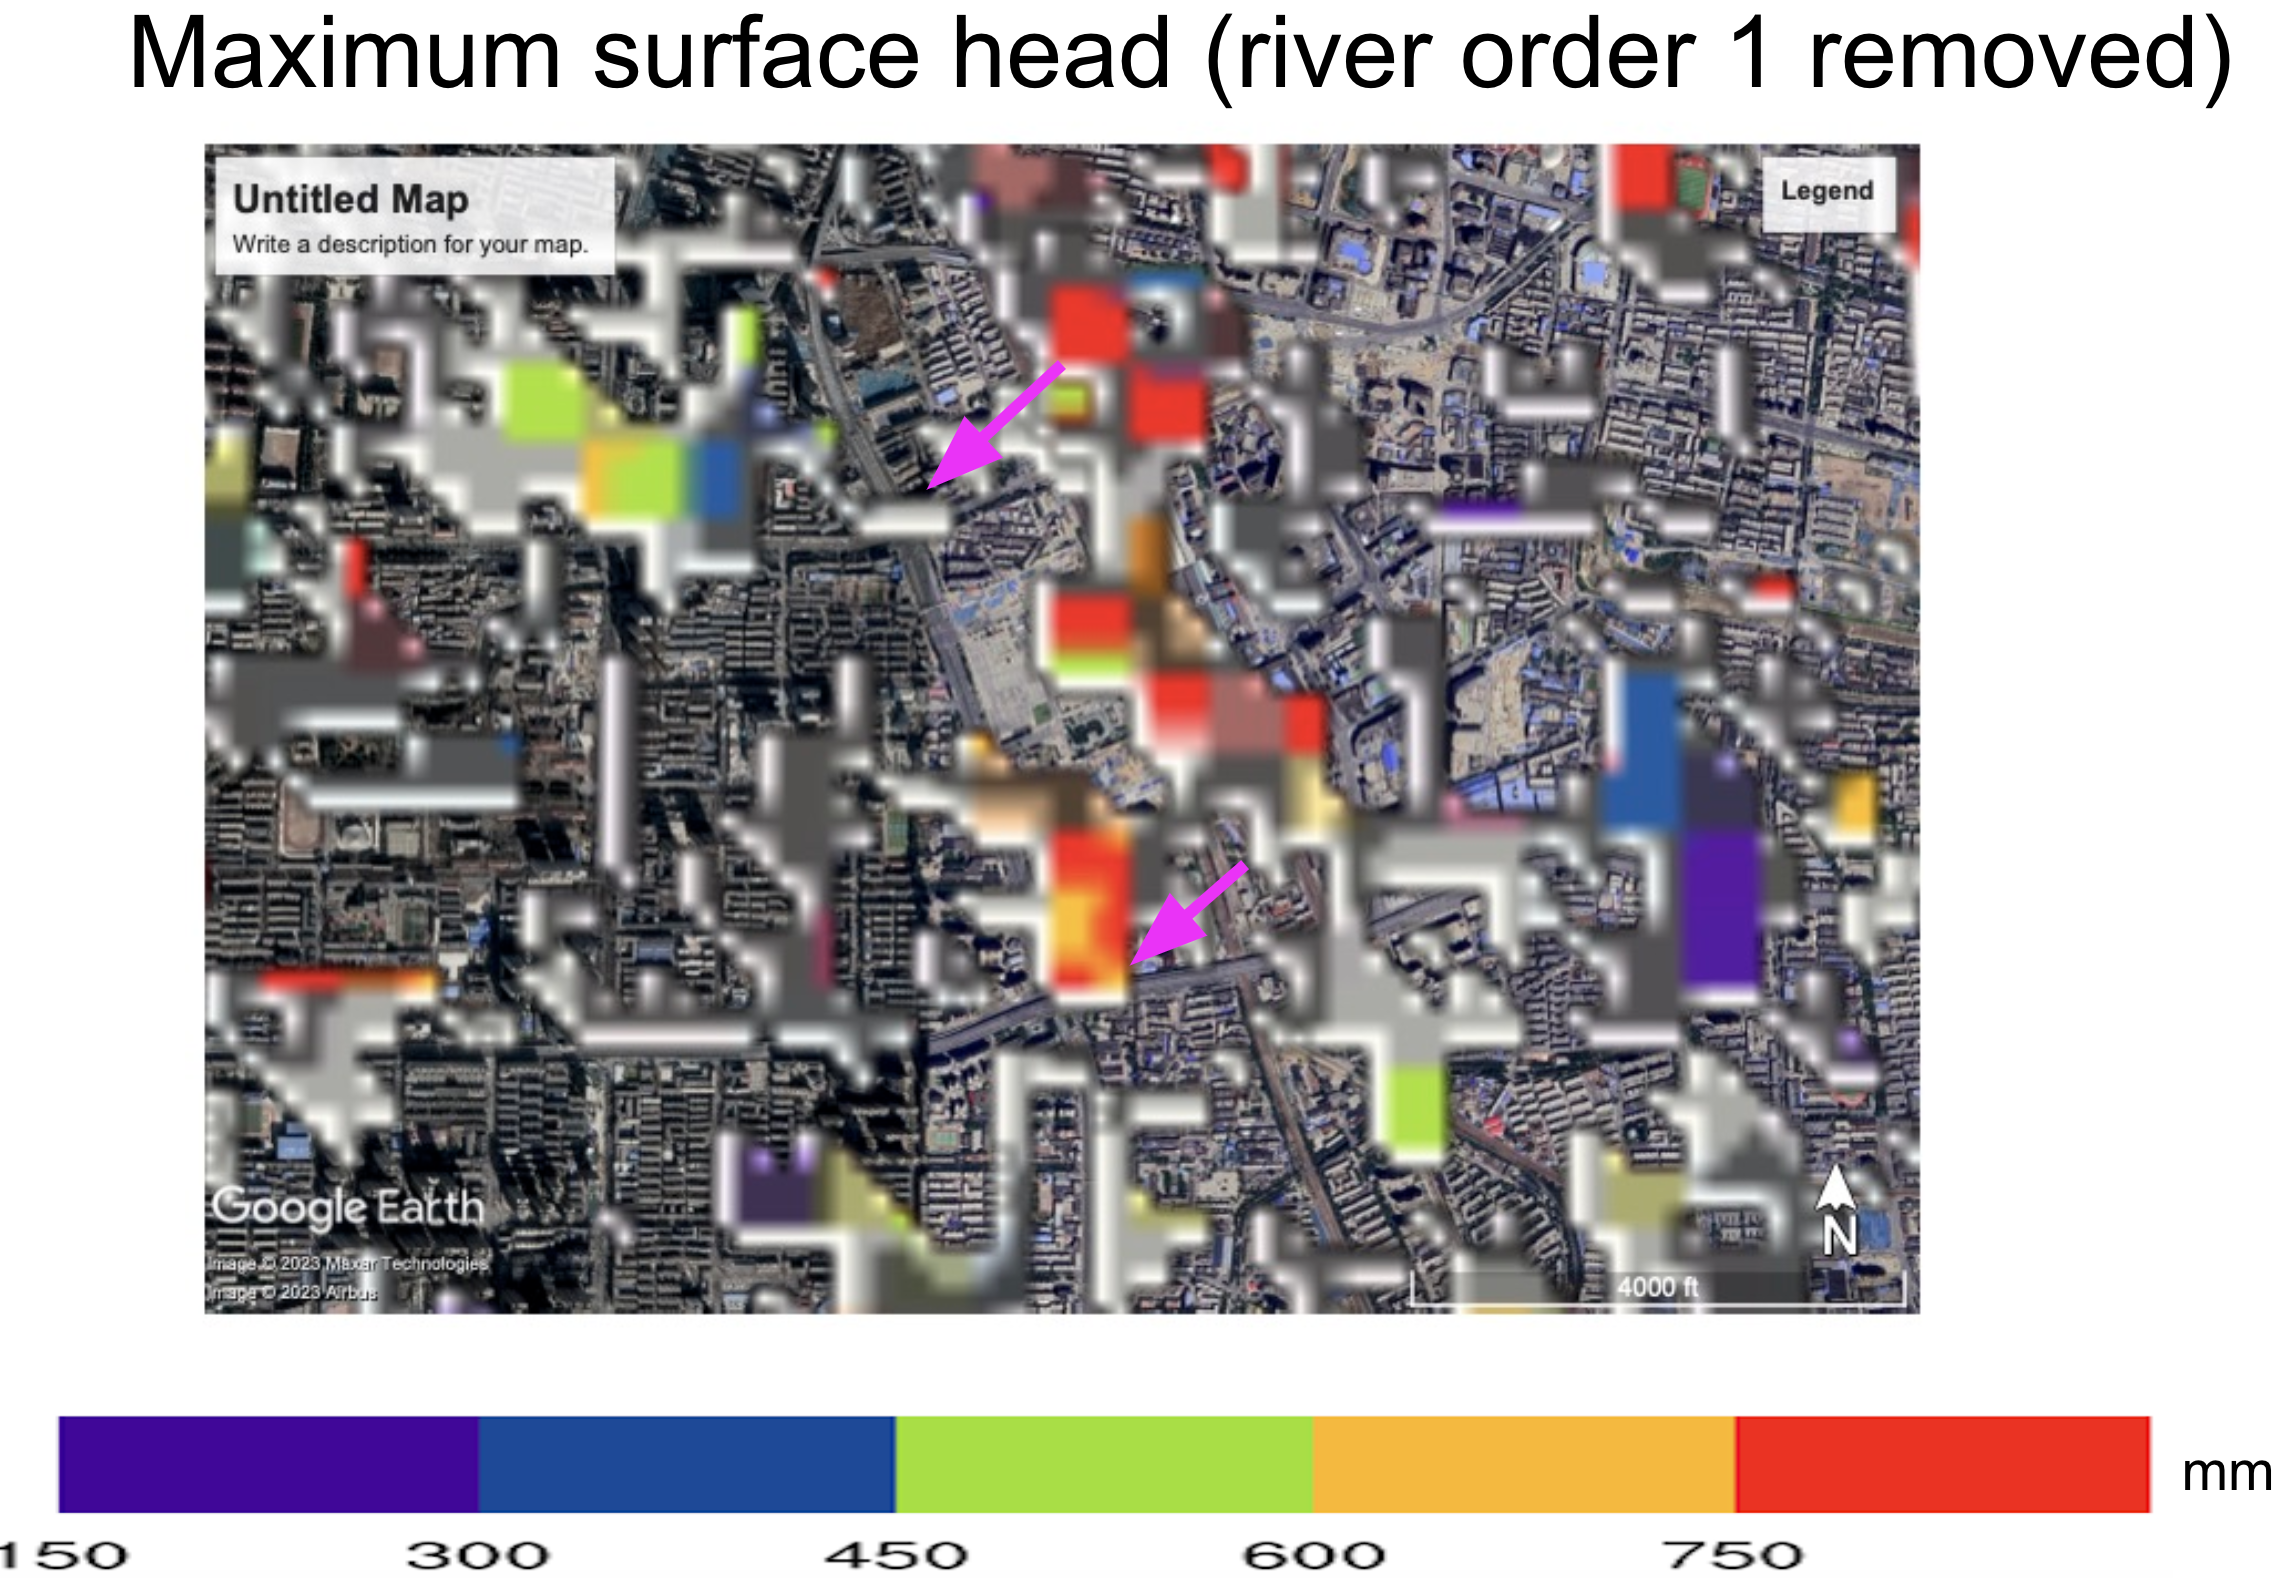
The model has parameters representing the urbanization features and can be applied for city flood forecast, flooding risk estimation as well as urban construction. The figure is the simulation of city flooding for 7/20 heavy precipitation events in ZhengZhou city. The filled color is the maximum surface water during the model simulation. The arrow is the tunnel entrance/exit location, which has significantly accumulated water due to the large-scale hydrodynamic process. It indicates the reason for the tunnel flooding, which caused a huge disaster in the loss of people’s lives.
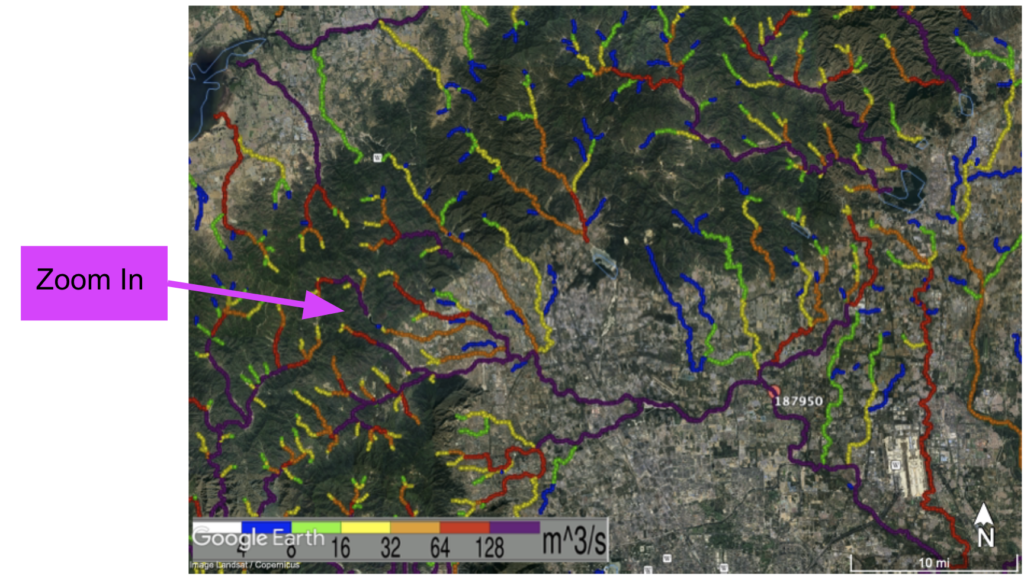
Case 4 flash flood warning – real-time application case

The right color is the terrain height. The bottom color is the river stream flow (m^3/s). It is a case from the real-time forecasting system. The figure is the maximum streamflow appeared during the model simulation. The flash flooding situation can be observed from one figure.
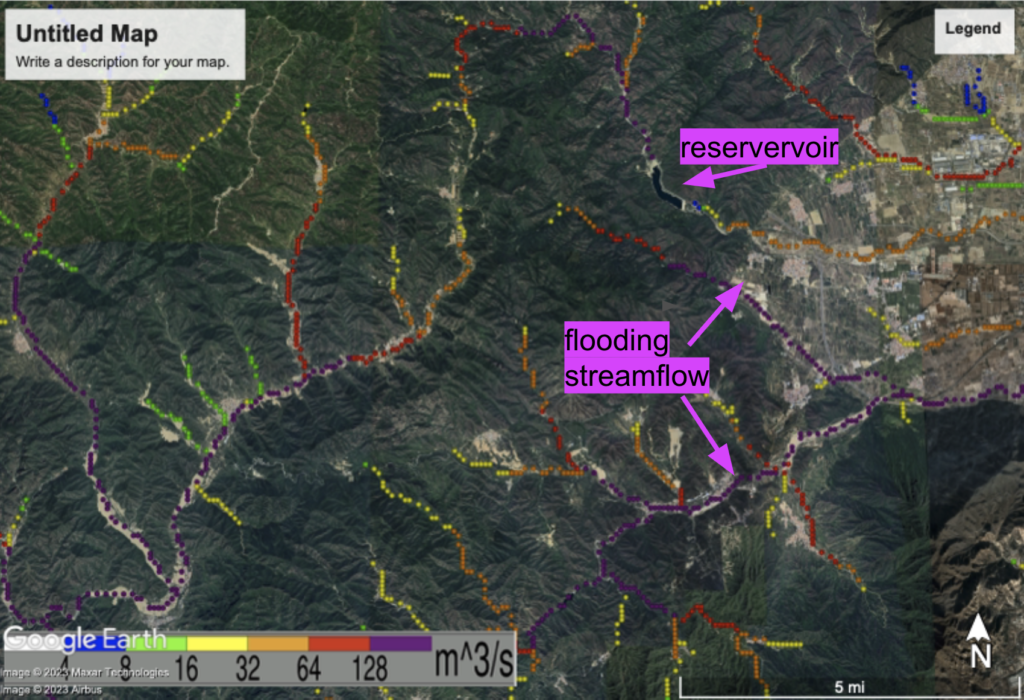
Case 5 Flash flooding simulation
The advancements in flash flood forecasting are instigating a pivotal shift in how decision-makers perceive flood situations. Picture this transformation as a single comprehensive figure that encapsulates the entire flooding scenario. In this enlarged image, high-resolution models operate with the precision of street-level decision-making, pinpointing flood locations with remarkable accuracy.
In real-time applications, consider a vast 10,000 square kilometer domain where a 6-hour flood forecast can be generated in less than 5 minutes. This is not merely a glimpse of what’s achievable; it represents a significant stride towards highly accurate flash flood predictions. This progress is particularly pronounced when these models are enhanced with AI-driven precipitation data obtained from state-of-the-art satellite or radar-based nowcasting.
To illustrate the impact of this advancement, let’s examine a case from July 31, 2023, in Beijing. The enlarged figure vividly displayed how the flooding peak reduced as it passed through the WangJiaYuan reservoir. Additionally, it highlighted a notable phenomenon—two distinct flood streamflows. This observation underscores the significance of flash flooding, especially in areas where downstream drainage is either compromised or insufficient. In such situations, the ability to predict flash floods becomes even more critical.
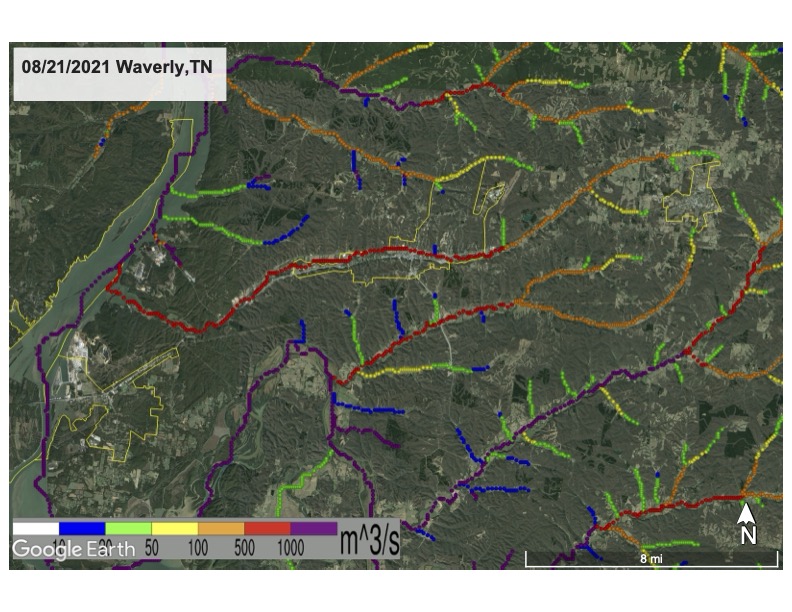
Case 6 Flooding Case for Waverly, TN
Presented here is the high-resolution hydrology model simulation depicting the flooding in Waverly (TN) on August 21, 2021. The initial visual showcases an animated representation of streamflow within the model’s geographical scope, while the subsequent illustration highlights the peak streamflow that appeared in Waverly. Our forecasting system is capable of real-time deployment in any location. In the real-time application, this information is integrated with radar-derived precipitation and forecasted products from the NOAA HRRR weather model. Additionally, the system automatically assimilates snow data when available.